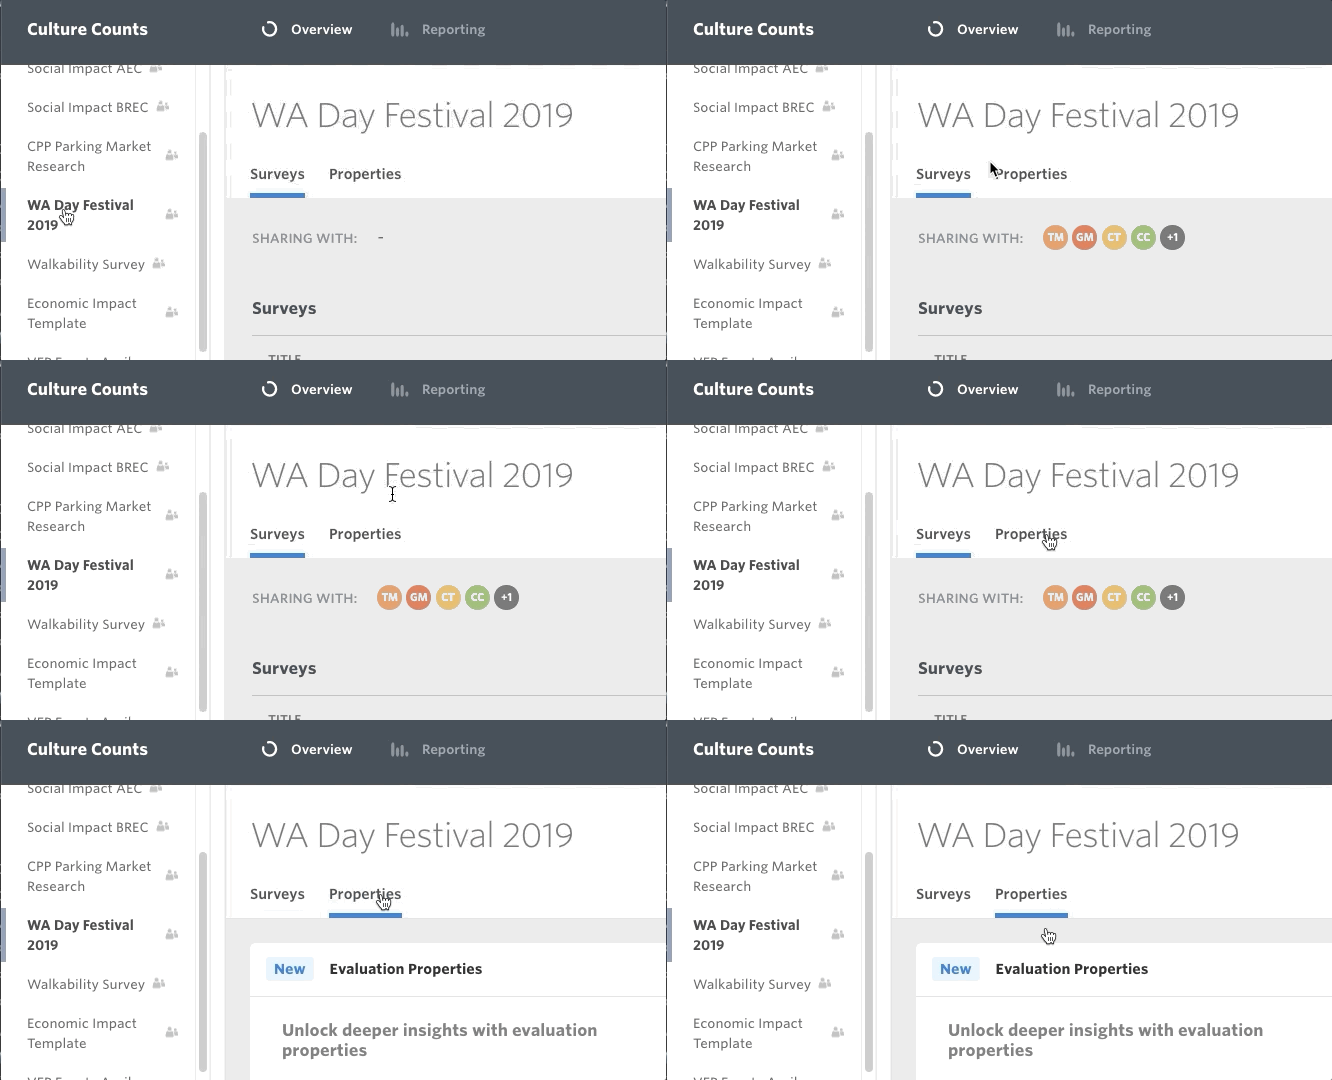
We get asked a lot about benchmarking, by good people, doing good work, looking for a way to show others their work is valuable.
Benchmarks are a great way to help us set a baseline, but we have to be careful when we use them. The difficulty with benchmarks is knowing exactly what you can do with them and precisely what they mean.
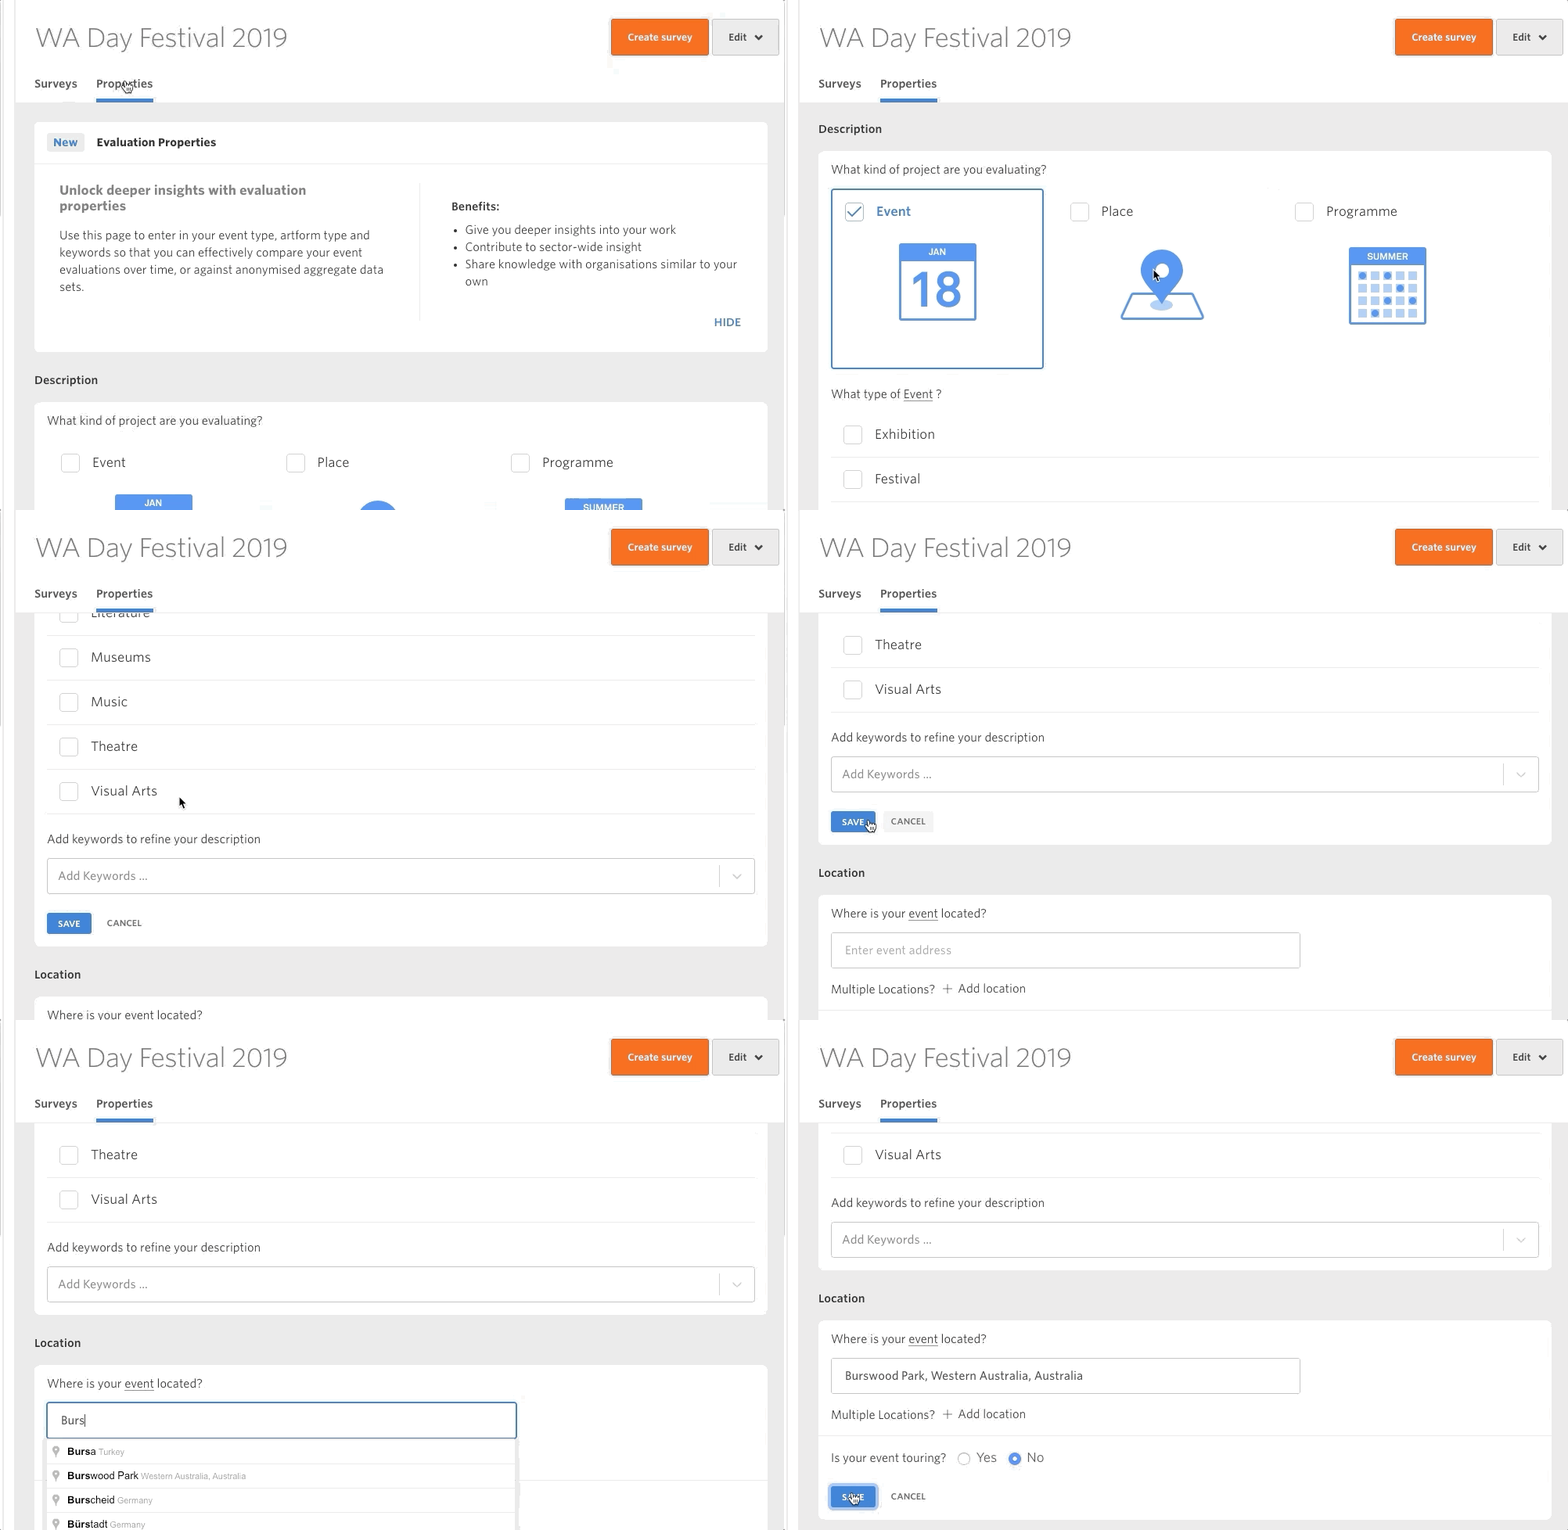
Here’s an example: many Culture Counts users want to be able to set their annual KPIs based on overall dimension benchmarks (i.e. the average). This is a fantastic first step towards embedding outcomes-based thinking into your management system. The trouble we run into though is not when someone performs well, but when they don’t. If the data on the backend is not complex enough to allow you to investigate the context of the benchmark, then it is incredibly hard for you to know where to go next. This is the problem we want to solve with Survey Properties.

This new feature gives users the power to add ‘properties’ to their evaluations. This means that evaluations don’t have to sit alone – we can start to include context. If you’ve completed an evaluation with meaningful results (good or bad) then I encourage you to log in and add some properties to it. This way, piece by piece, we can all contribute to a meaningful dataset that the whole sector can refer to.

Figuring out a way to generate meaningful insights from big data is at the forefront of modern data science. The technology to help us is coming (check out Open AI for a sneak peek of the possibilities), but the question is will we be ready for it? Adding context to our data is key to making sure our data works for us. Our recent joint initiative with Public Libraries Australia to create an evaluation working group is just one of the ways we want to help the sector move towards employing meaningful big data.
Read exactly how to use survey properties in the platform here. We’ve also got plenty more coming down the pipe that we’re excited to share. Stay tuned!


