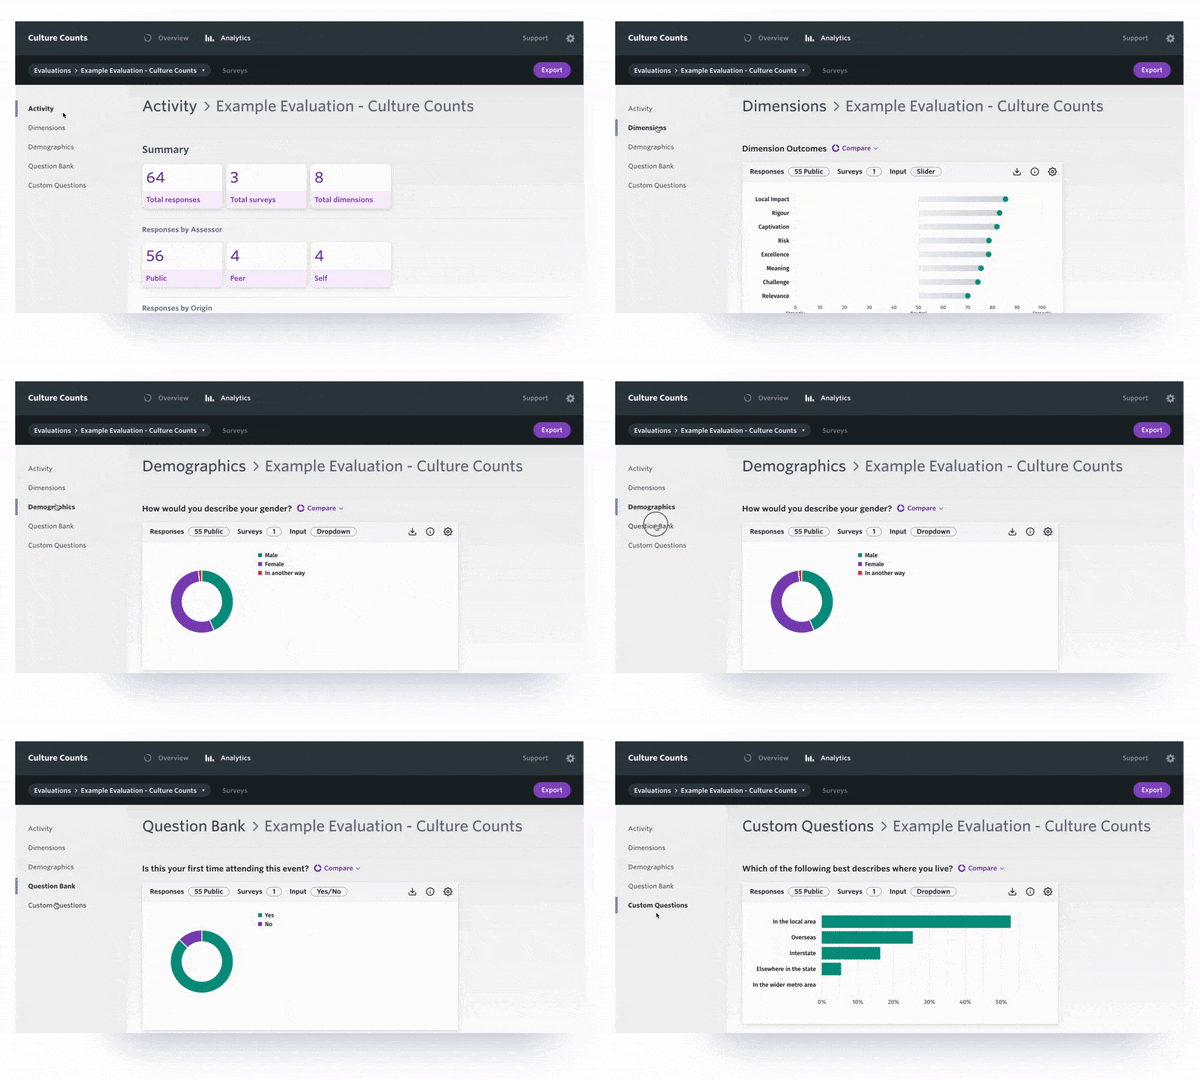
Culture Counts Analytics Dashboard
We are excited to announce the newest feature in the Culture Counts Evaluation Platform – the enhanced Analytics Dashboard. Designed for a more streamlined and tailored reporting experience, this update comes with an array of new chart types and filters to help you dive deeper into your data.
The Analytics Dashboard only shows your library’s data – it is a separate reporting tool from the PLEN Dashboard, which can be used to explore aggregated insights from all participating libraries in the network. For more information on the Analytics Dashboard, visit the Culture Counts Evaluation Platform Support Hub

Analytics Dashboard Breakdown
- Activity: Here, you’ll find a summary of your Responses, Surveys, and Dimensions count.
- Dimensions: Gain easy access to your dimension results and essential statistics, including margin of error.
- Demographics: View standardised charts for Age, Gender, Postcode, and Identity.
- Question Bank: Explore the results for other standardised questions sourced from our Question Bank, including Net Promoter Score and Overall Experience.
- Custom Questions: Delve into all results for custom questions in your survey.
Additional Resources
Was this helpful?
Let us know if you liked the post. That’s the only way we can improve.
