Overview
Step 4: Report results
Demonstrate your value
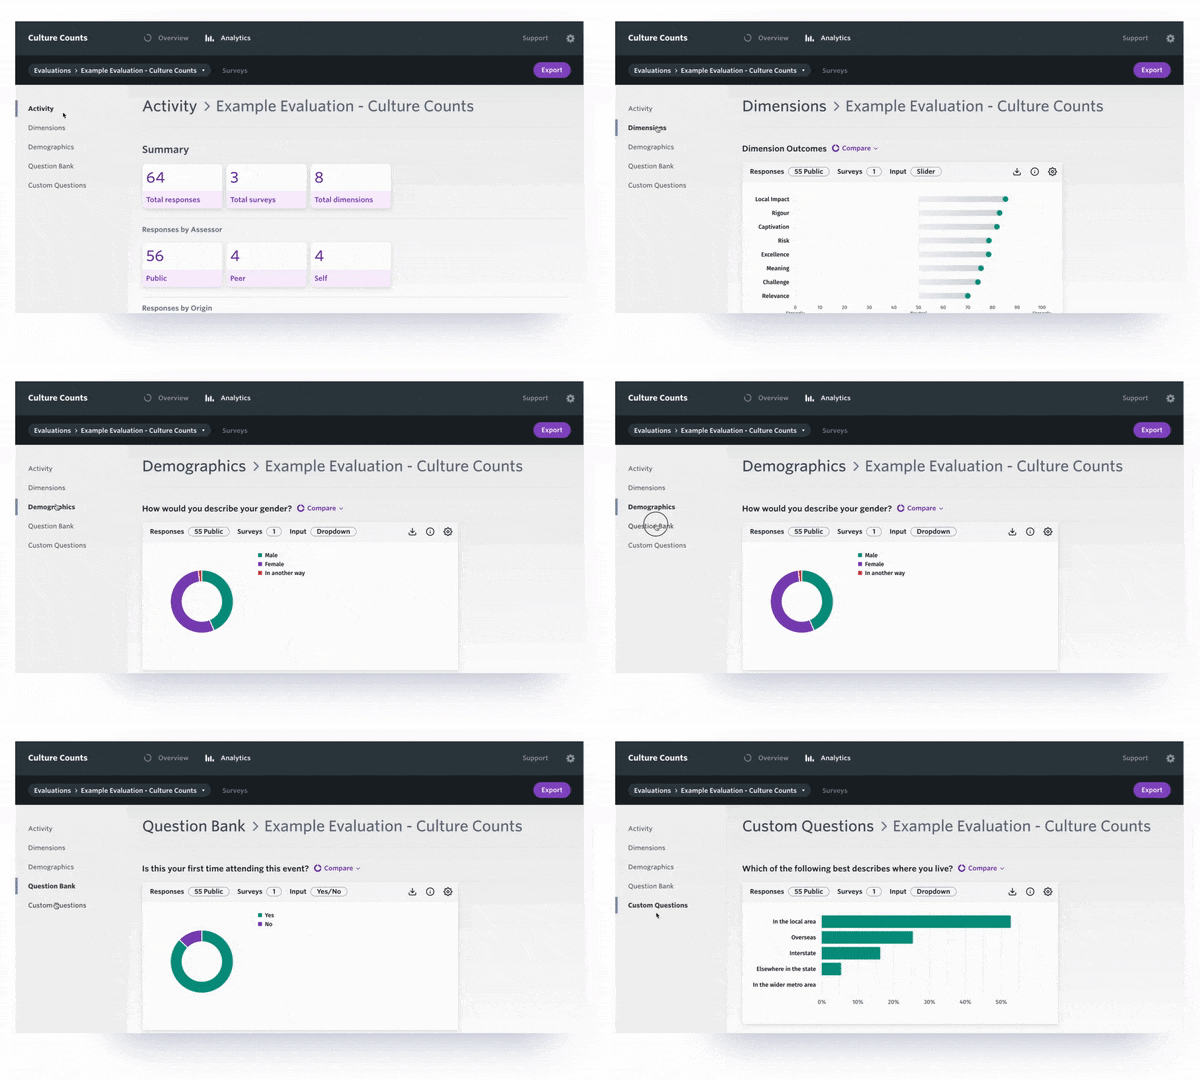
As you collect responses to your surveys, the data is displayed in a number of different charts within the Analytics section of the Culture Counts dashboard. The Analytics Dashboard summarises data collected in an Evaluation or Survey. To view a report, click on Analytics in the header menu from the Evaluation view. You will be taken to the data summary of the Evaluation you were just viewing.

In this section, we will cover the various components of the Reporting Dashboard, including how to view data in the Evaluation view or the Survey view.
We will walk through the different components of the Analytics Dashboard, including the Activity, Dimensions, Demographics, Question Bank and Custom Questions pages. Finally, we will look at the different ways that you can export data from Culture Counts and give you some pointers on how you can interpret the results and weave data into your report writing.
